Mean Median and Mode Calculator with Range – Instant Step-by-Step Results
Got a dataset and need all three measures at once? Our mean median and mode calculator gives you the mean, median, mode, and range with a full step-by-step breakdown. Enter numbers one by one or paste them all at once.
Formula: Sum of all numbers ÷ Total count of numbers
Sum = 0
Count = 0
Mean = 0 / 0 = 0
THE MEDIAN (MIDDLE VALUE)
Step-by-Step Breakdown
Step 1: Sort the dataset from lowest to highest.
Sorted Array: [ ]
Step 2: Find the middle number.
Waiting for data...
THE MODE (MOST FREQUENT)
Step-by-Step Breakdown
Logic: Count how many times each number appears.
Waiting for data...
Table of Contents
What is Mean? (The Average in Your Dataset)
Mean is the most commonly used measure of central tendency. It is simply the average. You add all the values in your dataset and then divide that sum by the total count of values.
Formula: Mean = Sum of all values / Total count of values
Example: Your dataset is 10, 20, 30. Sum = 60 Count = 3 Mean = 60 / 3 = 20
Mean is useful when your data does not have extreme values. If one value is too high or too low compared to others, the mean can be misleading. In that case, median is a better choice.
Our mean median and mode calculator shows you the mean alongside the median and mode in the same result so you can compare all three measures at once and decide which one represents your data best.
What is Median? (The Middle Value, Not the Average)
Median is the middle value of a sorted dataset. It does not care about extreme values. That is what makes it useful in real life data.
To find the median:
First, sort your numbers from smallest to largest
Then pick the middle value.
If the count of numbers is odd, the middle number is your median directly.
If the count of numbers is even, there is no single middle number. So you take the average of the two middle numbers.
Example with odd count: Dataset = 5, 10, 15 Sorted = 5, 10, 15 Count = 3 (odd) Median = 10 (the middle value)
Example with even count: Dataset = 5, 10, 20, 30 Sorted = 5, 10, 20, 30 Count = 4 (even)
Middle two numbers = 10 and 20 Median = (10 + 20) / 2 = 15
What is Mode? (The Most Frequent Value)
Mode is the number that appears the most times in your dataset. It is the simplest of the three to understand.
Your dataset can have one mode, more than one mode, or no mode at all.
No Mode: If every number appears only once, there is no mode.
One Mode: If one number appears more than others, that is your mode.
Multiple Modes: If two or more numbers appear the same number of times and both appear the most, then all of them are your mode.
Example: Dataset = 4, 7, 7, 9, 11 Mode = 7 (appears 2 times, more than any other number)
What is Range? (And Why It Belongs With Mean, Median and Mode)
Range is the simplest spread measure. It tells you how far apart your lowest and highest values are.
Mean, median, and mode tell you where your data clusters. Range tells you how wide that cluster spreads. That is why most teachers ask for all four together. Our calculator gives you all of them in one click.
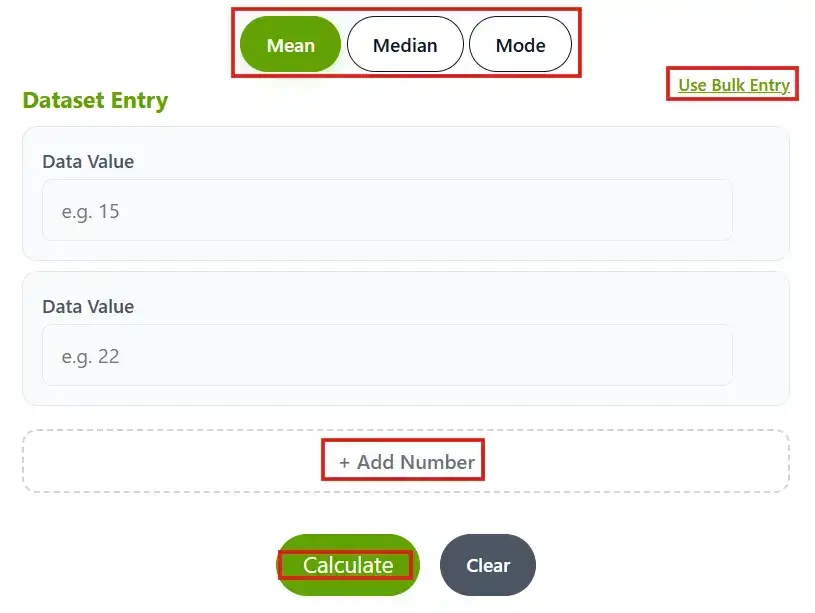
How to Use This Mean Median and Mode Calculator (Two Entry Modes)
This mean median and mode calculator gives you two ways to enter your data depending on how much you have.
You will find two ways to enter your data:
Individual Boxes: Enter each number one by one in separate boxes. Click “+ Add Number” to add more rows. This is good when you have a small dataset.
Bulk Entry: Click “Use Bulk Entry” and paste all your numbers at once separated by commas or spaces. This saves time when you have a large dataset.
Once you enter your data, click Calculate and you get your mean, median, mode, and range with a full step-by-step breakdown instantly.
Frequently Asked Questions
Is this calculator really helpful for students?
Yes, this calculator is genuinely helpful for students handling large datasets. Our bulk entry option makes computing big datasets quick and easy.
Does this calculator show a complete result breakdown?
Yes, our calculator doesn’t just show simple results. It provides a step-by-step breakdown too.
Is this a mean median mode and range calculator?
Yes. The result panel shows you the mean, median, mode, and range all at once. You do not need to switch between tools or calculate range separately.
Is this the same as a mean and mode calculator?
It covers more than that. This tool calculates mean, median, mode, and range together. If you only need one of them, just look at that tab in the result panel and ignore the rest.
Published By: CutoffCalculator Team
Admin
This calculator tool is developed and published by the CutoffCalculator Team. Our mission is to create an all-in-one platform for students that makes academics and education smoother.
Disclaimer: Our tool uses past data and trends, so it may be inaccurate. Always check with the official universities. If you find anything wrong, please report it immediately at [email protected], and we will update it as soon as possible.